
Behind The Metrics
Exploring The Realities Of Healthcare Call Center Performance Indicators
Pressed for Time?
Watch the video to the right and get this white paper content in under 5 minutes— then come back for a deeper dive into our findings by scrolling to the full version below. Or let Haxall know you would like to download a PDF version for later.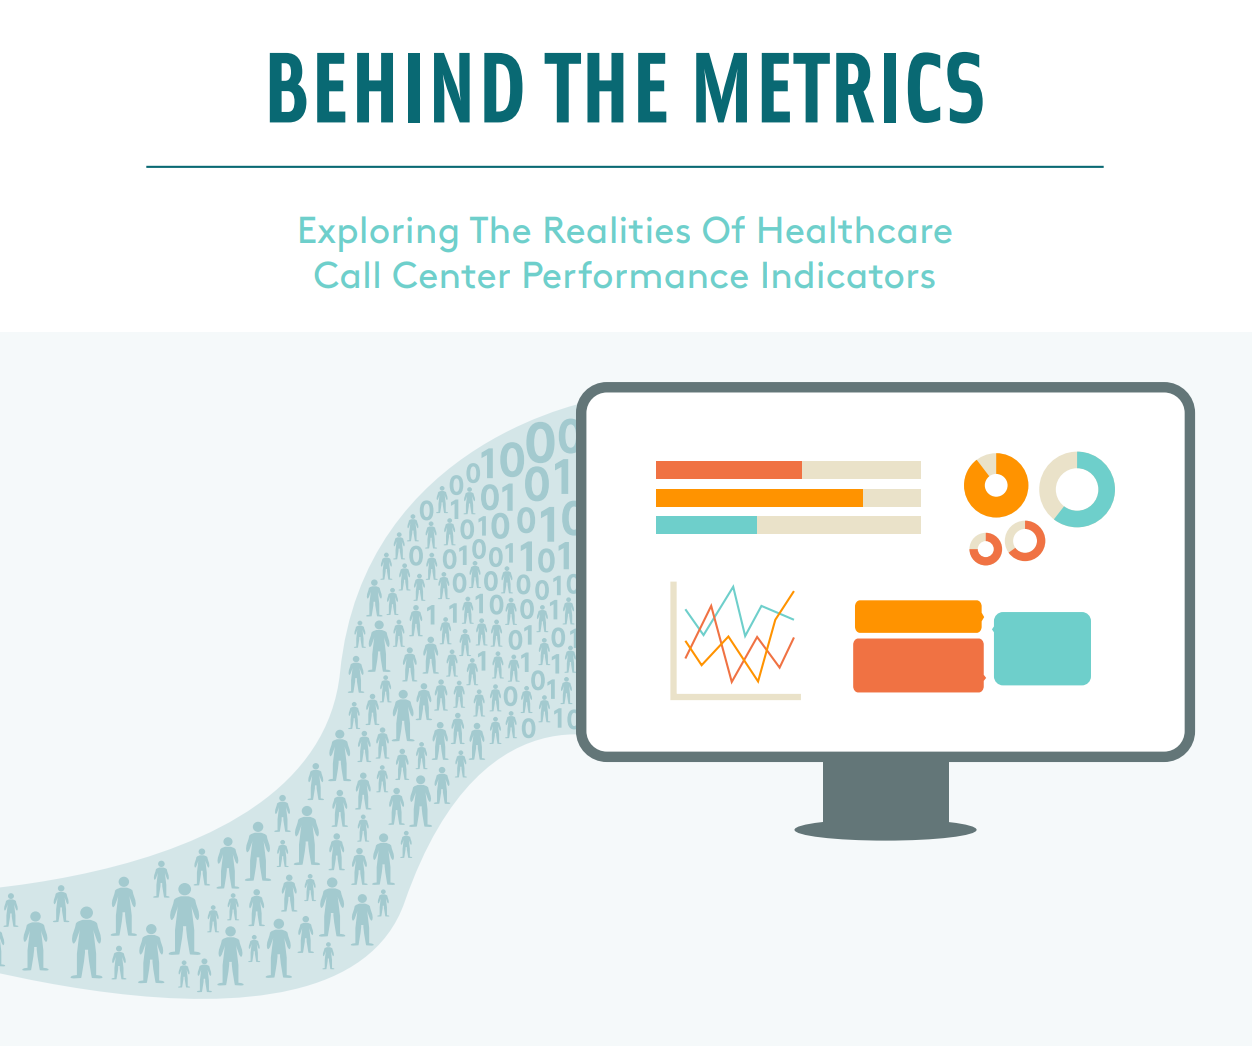
Abstract
Tracking call metrics is an essential part of monitoring the performance of your healthcare call center. Call metrics can reveal the effectiveness of internal processes and indicate areas where agents might be struggling. Beyond performance, these metrics can provide opportunities for broader analysis, assisting in developing trend data about scheduling preferences that can be used to improve access and maximize scheduling volumes. With such a wealth of performance data available, it can be easy to get mired down in the numbers but it’s important to remember…
Those aren’t just numbers, those are patient experiences.
This paper aims to dive deeper into healthcare call center metrics to illustrate their real-world impact, from patient sentiment to practice operations.
Call Metrics and the Healthcare Call Center
There are a variety of metrics and KPIs that are measured to gauge the effectiveness of call center operations and agent productivity. While these are important from a call center management perspective, a healthcare call center is unique: operational performance can only be deemed successful if it’s accompanied by excellent customer service. In a healthcare call center, the patient experience takes priority which renders many standard call center metrics meaningless as they would apply to another industry. Longer handling times, for example, would typically be interpreted as a failure on the part of agents but in a healthcare setting may be perfectly appropriate as patient needs are more complex, and things like empathy and active listening, that help extend care culture over the phone, simply take time. Considering this, performance metrics must be interpreted through a realistic lens, that is—
The experience they represent.
First, it must be understood that call metrics are rarely mutually exclusive. In a healthcare setting, they connect to shape a bigger picture of the patient experience. A simple example of this is high abandonment rates. Abandonment rates can be directly tied to a poor speed to answer, which tells us that patients are waiting for assistance so long that they give up. When metrics are perceived as experiences you can interpret their impact more accurately. In this case, abandonment rates don’t just translate to a bad patient experience, they also are representative of missed opportunities for prevention and treatment, as well as patient loss to competitors.
Using call metrics for the analysis of healthcare call center performance must be done in the context of patient access. This means going beyond the math to dive deeper into what is happening between agents and patients and how that impacts the big picture; from scheduling volumes and brand reputation to patient loyalty.
Consider The Source
Before diving into the idiosyncrasies of call metrics it’s important to consider the source of these ratings at your practice. There are three typical models for healthcare phone operations, and each can influence call metrics a little differently. Ideally, health organizations would have dedicated call centers for patient access. This model ensures the least amount of distraction for practice staff and the best resources for call center operations (technology, management, training). But many organizations have not yet invested in a centralized call center and still manage their phones onsite.
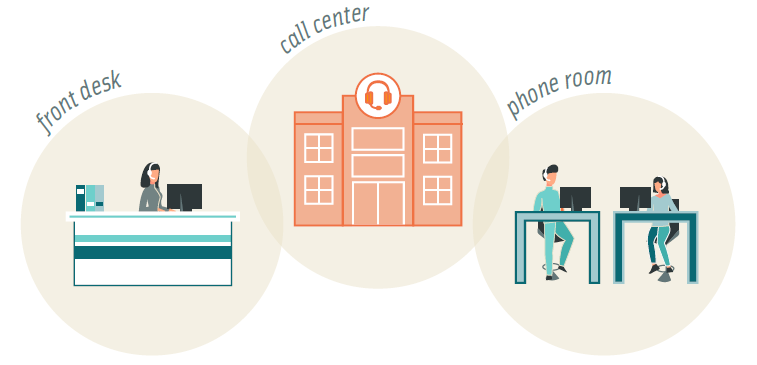
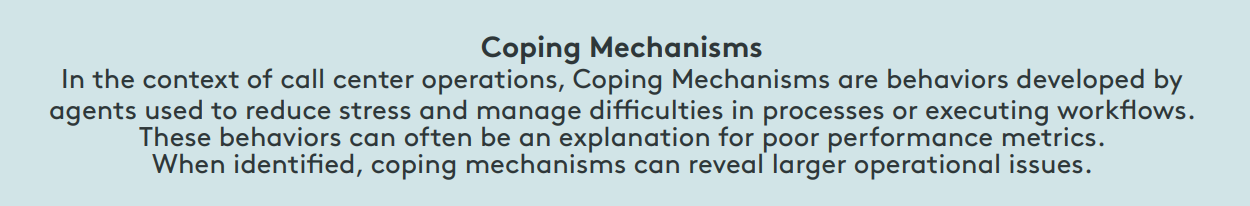
In this case, often front desk staff also act as phone agents. This creates a unique set of circumstances that should be considered when examining poor metrics: front desk staff is tasked with much more than managing the phones which means onsite needs can not only take priority over incoming calls but may also suffer because of them. A classic example of this is hold times. Commonly, we see overwhelmed front desk staff answer the phone and immediately put patients on hold. This is a coping mechanism for being burdened by phone management when busy with onsite needs. Staff will place callers on hold to finish a task or help the patient in front of them without distraction. In call metrics, this behavior appears as long hold times and high abandonment rates.
Alternatively, some organizations that manage their phones onsite have a dedicated phone room. This relieves some of the difficulties of having phones answered at the reception by removing the double duty of helping patients in person at the same time, however, agents in these cases are still typically front desk staff that are simply rotated in and out of phone duty. Here we commonly find issues with performance related to training and the necessity to frequently “switch hats.”
Failing to consider call metrics in relation to the unique operational circumstances that contribute to them, means you could also fail to see their solutions.
Abandonment Rate
Abandonment Rates simply reflect the number of patients who hang up before reaching an agent. While this is a common occurrence for any call center, it has special significance in patient access. Abandonment rates are typically tied to slow speed to answer. We know that waiting in general is a primary patient complaint. When it comes to a phone experience, most people are not willing to wait longer than 2 minutes— and the longer they do the more frustrated they become. When patients give up on contacting your practice they are often giving up on care or treatment, when especially frustrated they may give up on your practice as well.
Diving Deeper
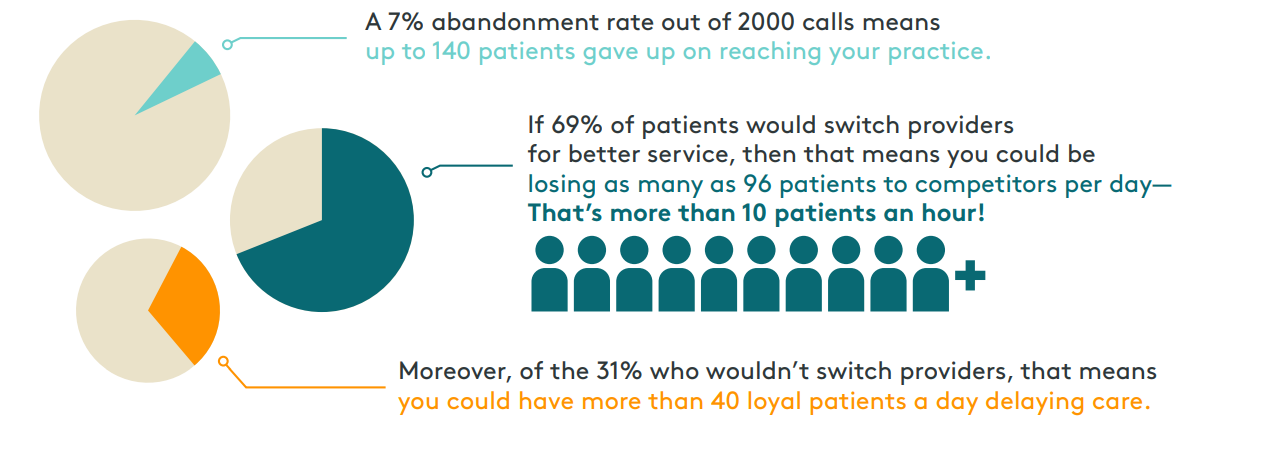
Call volumes can vary greatly based on practice size and specialty. Looking at the daily call volumes for some of the multi practice organizations that we serve we arrived at 2000 calls per day as a conservative estimate for typical inbound call volume. If your practice only takes calls during regular hours of operation (and doesn’t break for lunch) then that means you are processing roughly 220 calls per hour. A recent survey reported average abandonment rates between 5% and 8%, with the benchmark for healthcare being at nearly 7%. Though not all 2000 calls will be unique patients, by combining these numbers with survey data about patient behavior we can begin to understand the full impact of this single metric…
Operations View
High abandonment rates can be traced back to several operational issues within the call center. Inadequate staffing for the volume of patient calls, complex data entry or after-work processes, or confusing phone trees and the prerequisite to transfer multiple times are common root causes.
First Call Resolution
First Call Resolution (FCR) is intended to represent agents addressing all of the caller’s needs the first time, on a single call. There is some debate as to whether this is even possible for a healthcare call center as some patients will inevitably have reasons to call back, whether they need to reschedule or have a question for their provider. FCR rates are typically tied to handling times. With this in mind, lower FCR rates often indicate that patients are being rushed, experiencing multiple transfers, or agents are not exhibiting the values associated with care culture.
Diving Deeper
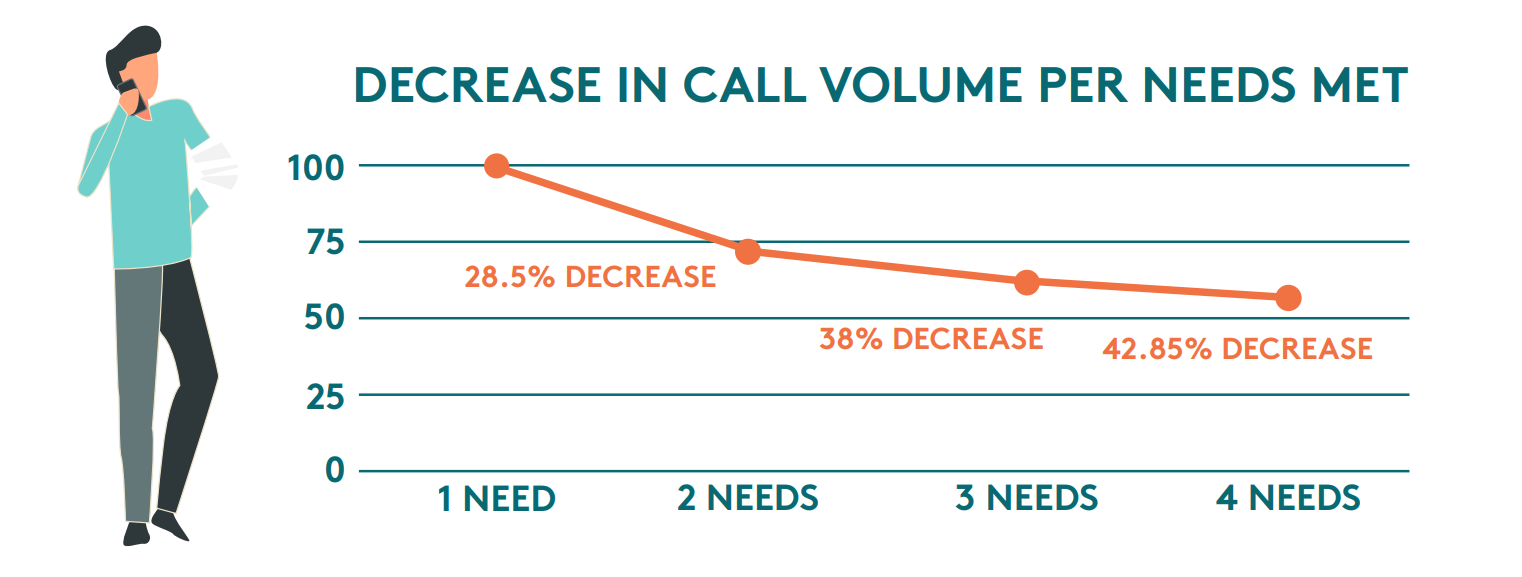
The industry benchmark for FCR in healthcare is 71%. This number may sound reasonable until you consider the reality that it means nearly 30% of patients fail to have simple needs met, like answers to care questions or appointments scheduled. Given the nuance of patient calls, however, this can be especially difficult to measure accurately. It may be more beneficial for Healthcare call centers to move towards something that resembles FCR but not in the same way that it is understood in other industries. Rather than focusing on a single need, agents should be focusing on multiple needs per call. When agents have high visibility into patient data they can anticipate needs, such as medication refills or upcoming screenings and preventative care, tackling multiple needs per call and minimizing the number of times a patient needs to contact the access center. Consider this…
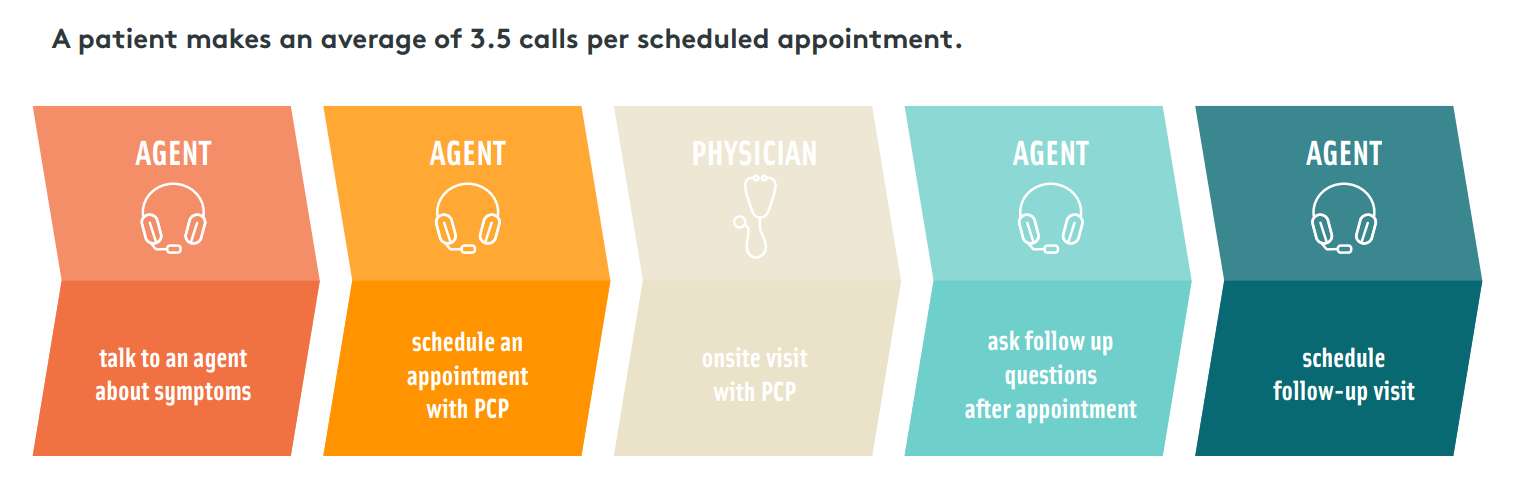
If a patient makes 3.5 calls per scheduling need, then tackling two scheduling needs on a single call could reduce the total average calls necessary by two (eliminating the initial call about symptoms and the call to schedule). Tackling three needs would reduce calls by four, and so on.
This conservative example doesn’t consider the likelihood that agents could also field questions to providers or schedule follow-up appointments at the same time— further reducing call volumes. This creates a ripple effect of benefits for patients and providers. A reduction in call volume can ease the burden on access teams, resulting in lower wait times and improved abandonment rates. Additionally, giving this level of attention to a patient's upcoming care needs not only increases scheduling volumes, but also ensures better patient outcomes— and provides patients with a more personalized experience.
Operations View
First Call Resolution rates are difficult to accurately measure for healthcare call centers. If the rate is truly reflective of a failure to meet patients’ needs, then it can indicate major problems in access. A lack of appointment availability, issues in phone tree design, unclear roles and responsibilities for access staff, or agents whose performance is rated by handling speed are all possible explanations. Likewise, poor or frequent changes to call handling guidelines may contribute to this problem.
Handling Time
Average Handling Time (AHT) describes the amount of time that an agent spends per patient call, including talk time, holds or transfers, and wrap-up time. The average handling time for any call center is 6 minutes 10 seconds, in healthcare, the benchmark for handling time not including wrap-up is 3 minutes 22 seconds. Using this metric to gauge agent performance is tricky for healthcare as patients call with a variety of different needs. Likewise, the role of patient access representatives is more nuanced than agents in other industries; workflows are more complex, and patients expect a high degree of personalization, customer service, and interactions that mirror care culture. While too long of handling times may indicate a problem, so can too short. Short handling times are inevitably linked to poor FCR rates and customer service.
Diving Deeper
While AHT can contribute to other metrics, like FCR, ASA, and hold times, they are the one metric most tied to the patient experience. Patient access representatives often set the tone for the patient journey with the initial phone interaction. In patient surveys, the words most used to describe a bad patient experience are “rushed,” “rude,” “wait,” and “dismissive.” When asked to identify why the patient experience was so important, more than half of patients point to being treated with respect and taken seriously. This emphasizes the importance of extending care culture over the phone and why striking a balance between efficiency and courtesy is especially important…
Translating these statistics to a healthcare call center that fields 2000 calls a day means poor service will create a ripple effect impacting the experience of as many as 1240 patients, 1116 of which might take it to heart.
At worst, 837 will delay scheduling their next appointment and 725 will look for a new provider.
When 96% of patient complaints are related to customer service, longer handling times may be more beneficial to the big picture. If workflows are tackling a variety of patient needs on each call, ensuring that agents are making genuine connections and personalizing interactions with the compassion and empathy expected from healthcare professionals, then extended handling times are more valuable than any operational gains made by low AHT.
Operations View
AHT is most useful as a performance indicator when analyzed by its parts; talk time, hold time, and wrap-up time. Lengthy holds and wrap-time can be indicative of poor agent training, inefficiencies in workflows, or difficulties with software and technology. Unusually brief handling times are common when front desk staff is also responsible for phones, as it can become a habit to rush callers when busy with patients onsite. Streamlining internal processes and investing in automation where applicable can improve AHT and ease the burden on agents.
Hold Time
Hold Time refers to the length of time in which patients are put on hold by an agent. Benchmarks for hold times can vary greatly by industry, and practice type, but some sources indicate that 50 seconds is average for healthcare call centers. Hold times contribute a great deal to your overall handling times and can have a major impact on the patient experience. It’s no secret that patients don’t like to wait. When surveyed approximately two-thirds of patients are unwilling to wait longer than two minutes… 13% find any amount of time unsatisfactory. When patients on hold become frustrated, they abandon the call and more than a third will never call back. But it’s important to keep in mind that they are also abandoning why they called— impacting scheduling, patient outcomes, and new patient volumes.
Diving Deeper
New patients are essential to continuity. It’s estimated that the average practice loses about 10% of patients a year due to normal life circumstances (relocation, death). The average gain for new patients is 25% annually. These statistics not only indicate growth potential year over year but can reveal a lot about patient retention— is your patient volume growing 15% on average? If not, then it could indicate a problem with the patient experience.
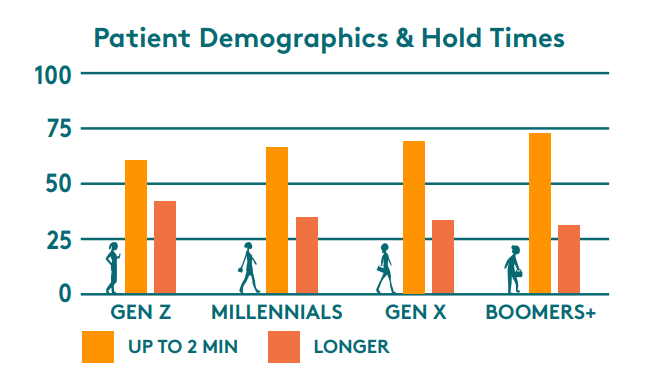
Patience for hold times wanes with the age of your patient population. This is important because, though millennials now make up most of the overall population, older generations require more medical care and therefore make up more of your scheduling volumes. Additionally, younger generations are more likely to skip or delay care. CDC statistical findings show that patients aged 45 and up (Gen X and beyond) make up approximately 83% of office-based physician visits for patients over the age of 18.
Using the multi-practice model of 2000 calls per day, that could translate to as many as 1660 patient calls from older demographics. In that case, you've lost roughly 381 patients to hold times longer than two minutes. At least 95 of which would have been new patients.
Operations View
Like overall handling times, lengthy holds usually point to process, technology issues, or poor agent training. If your call center hold times are excessively long it may be time to examine your phone tree, call routing, and scheduling workflows to eliminate agent pain points and ensure patients are reaching the best person the first time. Hold times can also commonly be a result of habit, agents will answer the phone and immediately put a caller on hold. This is a typical coping mechanism for busy front desk staff or a sacrifice to improve the speed to answer.
Speed to Answer
Different than hold times, the Average Speed To Answer (ASA) tracks how long a patient sits in the queue before an agent picks up the call. The ASA benchmark for healthcare is 3 minutes 22 seconds, well beyond the industry standard of 28 seconds. We have touched briefly on why this is such a difficult metric for healthcare call centers in particular: agents have more difficult workflows, leading to greater handling times, which can impact the call volume they can handle. Ultimately this is a failure to properly staff for inbound call volumes, or, commonly, fluctuating call volumes during peak times. But patients don’t care if you are staffed or not, they care if you answer in a minute or less— if not at least 60% of them will abandon (and we know what that leads to).
Diving Deeper
Appropriate staffing for inbound call volumes is essential to ensuring the high level of customer service patients expect. Proper staffing not only improves ASA but can also give agents the breathing room necessary to deliver a superior patient experience, exhibiting empathy and active listening that demonstrates the values of care culture over the phone.
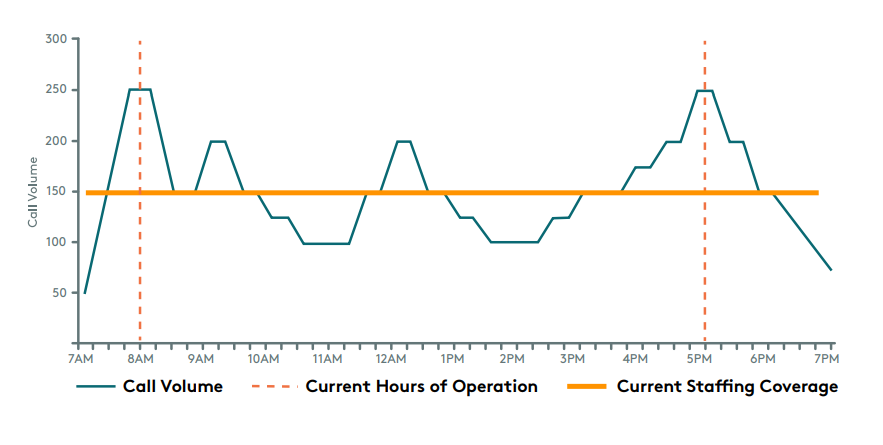
The graphic to the right illustrates peak call times in relation to standard staffing practices and hours of operation. It’s easy to see why staffing for these hours is so difficult: patients call when it’s most convenient for them, before or after work, and during limited lunch breaks. Often call center hours fall right over the top of standard working hours, eliminating any opportunities for contact before or after. Additionally, the couple of peaks we find common in the late morning and early afternoon are such short time frames it is not seen as cost-effective to staff to those levels— and those are precisely the areas where ASA is impacted the most.
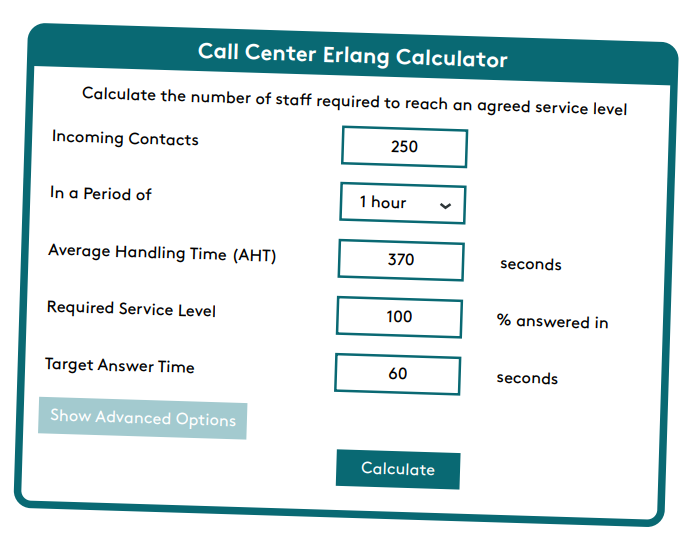
Using the above model, alongside what we know about patient behavior and abandonment rates we can conservatively estimate a patient loss due to poor ASA of 225. Taking this number and inputting it with AHT data into an Erlang Calculator (a calculator specifically designed to determine call center staffing) then we arrive at 57 agents necessary to ensure ASA of under one minute during peak volumes.
In the previous model, the standard staffing coverage is 60% of what is necessary to meet peak volumes, or 23 agents less than required. The average healthcare call center agent makes $17 an hour, which means operating at a 23-agent deficit for eight-hour days saves approximately $3128 FTE. Considering there are 260 workdays a year, that’s an annual FTE savings of $813,280.
The average physician office visit yields approximately $200 in revenue, this means that 225 patients lost to poor ASA results in a potential revenue loss of $45,000… per day. Now consider that the average patient schedules at least 4 visits per year. If 25% of those losses were new patients (56) that’s $44,800 in annual new patient revenue potential… per day.
That’s more than $11.5 million in new patient revenue annually.
Operations View
Poor Speed To Answer is directly tied to insufficient staffing for inbound call volumes or in consideration of the complexity and handling time of each call. While handling time and after work should be examined when ASA is subpar, increasing staffing levels (whether hiring internally or outsourcing additional agents for peak hours) is nearly always the solution. This is a key metric for phone management that is tied to front desk duties.
Transfer Rate
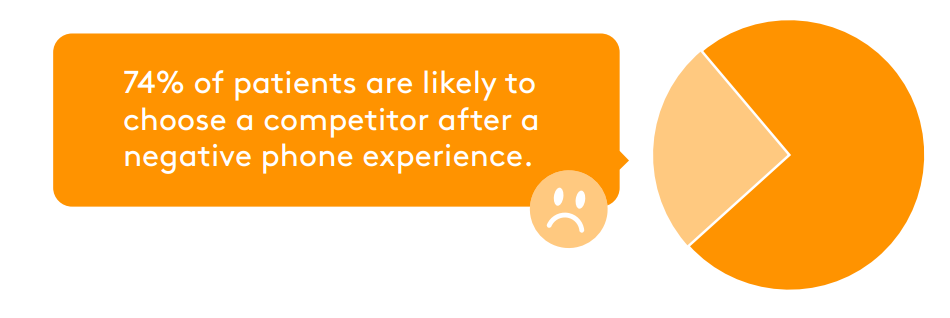
Transfer Rate refers to the number of inbound calls that an agent transfers to another agent or department. Industry benchmarks for escalations and transfers can be as high as 19% though due to the nature of access management and the habit of decentralization that number can vary greatly for healthcare. Transfer rates can have a big impact on FCR, handling time, and abandonment rates. Unusually high transfer rates indicates one of two issues: the phone tree is mismanaged or agents are incapable of handling patients’ needs. Either way, this is a huge red flag for the patient experience. In fact, studies show that a single transfer lowers satisfaction ratings by 12%. When patients value convenience and being heard over everything else, the negative impact of being put on hold and having to repeat their requests become obvious.
Diving Deeper
At its worst, high transfer rates can mean that patients are subject to a merry-go-round of call routing, passed perhaps multiple times to staff who cannot help them, and often dumped at a voicemail box. Studies have shown that a poor phone experience can directly impact patients’ perception of access and quality of care— if they have to repeat their needs, are routed incorrectly, subject to long holds, and ultimately not having their needs met they will assume that their care experience will be the same. This can have detrimental impacts on patient loyalty and trust. Research indicates that it only takes two negative phone experiences to diminish a patient’s perception of their provider.
Using the previous 2000 call model, 74% means a single day of poor phone performance risks the retention of up to 1480 patients.
Research indicates that it costs 5 times as much to attract new patients as it does to retain established ones. You can determine your patient acquisition costs by dividing your annual marketing expenditures by the number of new patients each year. To determine the ROI on patient retention, you need to estimate the lifetime value of your established patients. This can be done by multiplying the average appointment value by the average number of appointments per year, and then by the average number of years in your patient lifecycle. This can vary significantly based on practice types, pediatric relationships for example are shorter-lived than Primary Care relationships, which can last decades.
The average patient sees their PCP about 4 times per year. If the appointment value is $200 and the average patient life cycle is 15 years then the lifetime value of each established patient is $12,000.We previously established that average new patient growth is approximately 25% and typical patient loss (for non-customer service-related reasons) is 10% annually.
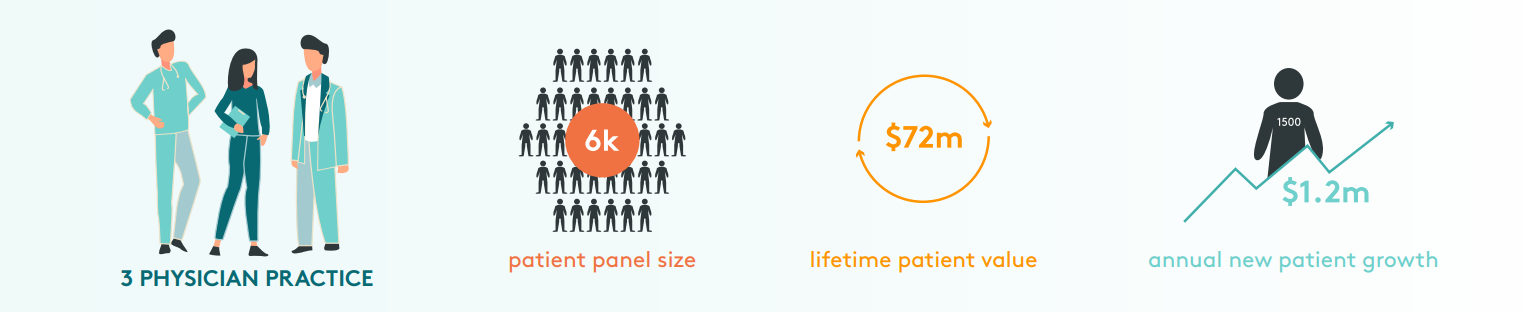
The average three-physician practice would have a patient panel size of approximately 6,000. This translates to a combined lifetime patient value of $72 million (or $4.8 million annually), with annual new patient growth worth about $1.2 million (1500 patients).
The average primary care physician spends $890 a month on marketing, so a three physician practice would average a little more than $32,000 a year for new patient acquisition. For a practice that grows the anticipated 25% that lowers new patients’ annual value by 2.667%. This means 10% of your patient panel is replaced at -2.667% value annually, giving a compounding effect of -$57 million over a 15-year lifecycle— And that’s just calculating average patient turnover!
A practice risking 74% patient retention to poor phone experiences could reach a $57 million loss in under 3 years.
Operations View
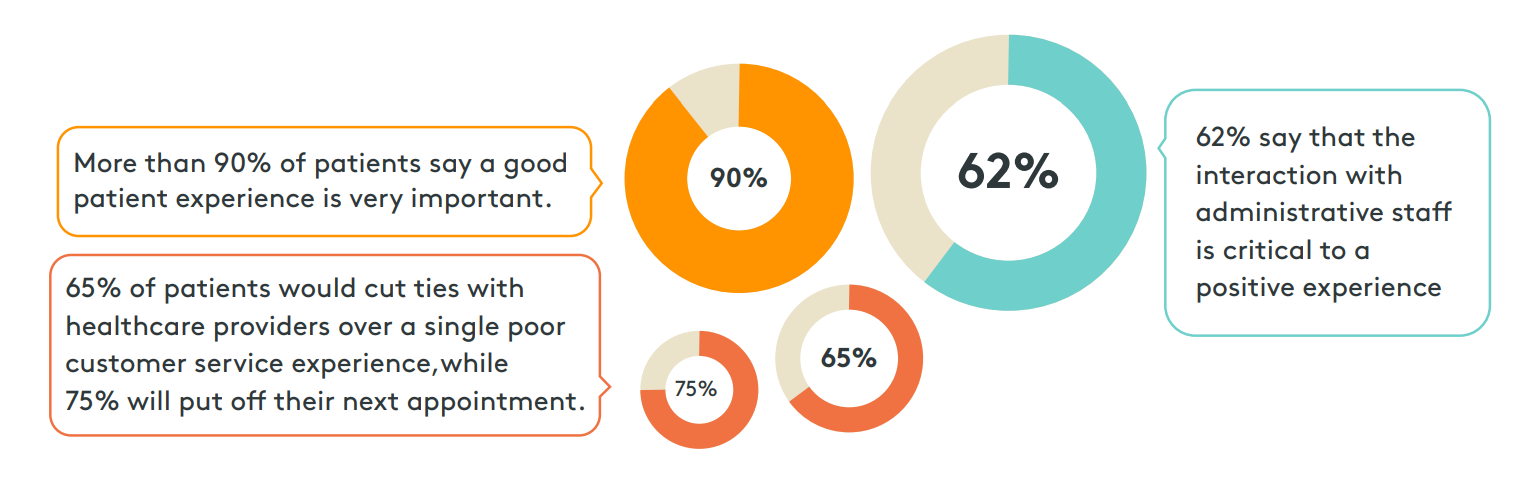
High transfer rates indicate staffing challenges or inefficient phone processes. Begin by investigating agent training to determine if there is a knowledge gap in the call they are routed and their ability to service those patients’ needs. Then examine your phone tree, routing workflows, and review your procedural guidelines to ensure transfers are not a result of poor documentation. When 89% of patients say ease of access is the most important factor when finding healthcare, this is not a metric you can ignore.
The Only Metric That Matters: Patient Satisfaction
At the end of the day, the most important performance metric is Patient Satisfaction. Patient Satisfaction scores are generated through surveys. These surveys, commonly conducted by eight out of ten healthcare organizations, are used to rate service levels in a variety of areas, from the ease of access to the quality of physician care. They generally consist of questions that ask patients to rate their satisfaction levels alongside their perceived value of service. The results can be used to drive quality improvement to retain patients in an increasingly competitive healthcare marketplace.
The two primary patient surveys are HCAHPS and Press Ganey. The Hospital Consumer Assessment of Healthcare Providers and Systems (HCAHPS) survey is the first national, standardized, publicly reported survey of patients’ opinions of their care in the hospital. While Press Ganey is the industry’s recognized leader in healthcare patient satisfaction working with more than 10,000 healthcare organizations nationwide to improve clinical and business outcomes. This survey is used by many practices to gauge how well they are servicing patients and commonly includes questions directly geared toward the access experience.
Press Ganey sends surveys that are grounded in a scientifically rigorous methodology, with a thorough process that reviews existing questions, constructs new questions, tests new surveys, and validates and confirms psychometrics. Some of the most frequent complaints from satisfaction surveys are related to difficulties in scheduling. The process is often reported as being confusing and stressful because of extended wait times on the phone or the inability to cancel an appointment before being charged a fee. While there are many specifics used to rate patient satisfaction, they all funnel back to one key aspect of the patient experience: effort. “Effort” is more than just “ease of use,” it is the amount of energy a patient must expend to get treatment. 42% of patients say the effort it takes to connect with their healthcare provider is the biggest obstacle they face in communicating with their providers. Additionally, since patients don’t usually seek medical services when they are feeling well, any extra effort can feel especially burdensome.
Confusing phone trees, long wait or hold times, and multiple transfers add to the perceived effort required to get service. Making that critical first step in the patient journey as quick and painless as possible by extending the values of care culture over the phone to not only tackle patients’ needs the first time but support their upcoming needs as well can ensure a positive patient experience that builds trust and inspires loyalty. Furthermore, an efficient patient access experience doesn’t just impact satisfaction with the phone experience, it sets the tone for the patient journey to follow.
Sources:
Arise. (2017, February 7). Arise 2017 Customer Service Frustration Series: Phone Hold Times | Blog | Arise. Www.arisevirtualsolutions.co.uk.
https://www.arisevirtualsolutions.co.uk/resources/blog/arise-2017-customer-service-frustration-series-phone-hold-times
Ashman, J., Rui, P., & Okeyode, T. (2019, June 7). Characteristics of Office-based Physician Visits. Www.cdc.gov.
https://www.cdc.gov/nchs/products/databriefs/db310.htm
Avtek. (2021, June 7). 10 Stats About Patient Experience in 2021. Avtex. https://avtex.com/resources/10-stats-about-patient-experience-in-2021
BCBS. (2019, April 24). Blue Cross Blue Shield Association Study Finds Millennials are Less Healthy than Generation X Were at the Same Age | Blue
Cross Blue Shield. Www.bcbs.com.
https://www.bcbs.com/press-releases/blue-cross-blue-shield-association-study-finds-millennials-are-less-healthy
Builders, P. (2021, September 3). Top 10 Front Desk Training Tips for Medical Offices. Practice Builders.
https://www.practicebuilders.com/blog/top-10-front-desk-training-tips-for-medical-offices/
Call Centre Helper. (n.d.). Erlang Calculator for Call Centre Staffing. Www.callcentretools.com. Retrieved April 14, 2023, from
https://www.callcentretools.com/tools/erlang-calculator/
Call Centre Helper. (2016). Average Speed of Answer. Call Centre Helper. https://www.callcentrehelper.com/average-speed-of-answer-89615.htm
Call Centre Helper. (2017, October 17). How to Measure Average Handling Time (AHT). Call Centre Helper.
https://www.callcentrehelper.com/how-to-measure-average-handling-time-52403.htm
CVS Health. (2021). Health Care Insights Study 2021 | CVS Health. Www.cvshealth.com.
https://www.cvshealth.com/news-and-insights/programs/health-care-insights-study/2021-report
Fontella, C. (2022, May 30). What’s Average Handle Time, & How Do You Cut It in Half (Or More)? Blog.hubspot.com.
https://blog.hubspot.com/service/average-handle-time
Fry, R. (2020, April 28). Millennials overtake Baby Boomers as America’s largest generation. Pew Research Center.
https://www.pewresearch.org/fact-tank/2020/04/28/millennials-overtake-baby-boomers-as-americas-largest-generation/
Fuoco Antonelli, A. (2023, March 20). Weekly line: Millennials are sicker and poorer than prior generations. Here’s how that’s changing health care.
Www.advisory.com. https://www.advisory.com/daily-briefing/2020/01/17/milennials-weekly-line
Gier, J. (2017, April 26). StackPath. Www.hcinnovationgroup.com.
https://www.hcinnovationgroup.com/clinical-it/article/13008175/missed-appointments-cost-the-us-healthcare-system-150b-each-year
Griffith, K. N., Li, D., Davies, M. L., Pizer, S. D., & Prentice, J. C. (2019). Call center performance affects patient perceptions of access and
satisfaction. The American Journal of Managed Care, 25(9), e282–e287. https://www.ncbi.nlm.nih.gov/pmc/articles/PMC8177735/
HFMA. (2012, October 25). Ask the Expert: Setting Industry Standards for Call Center Activities. HFMA.
https://www.hfma.org/revenue-cycle/kpis/7256/
McMillen, S. (2019, December 11). How to Measure Contact Center Effectiveness: Start with Calls per Scheduled Activity. Www.ecgmc.com.
https://www.ecgmc.com/thought-leadership/blog/how-to-measure-contact-center-effectiveness-start-with-calls-per-scheduled-activity
MGMA. (2018, June 7). Satisfaction for the patient wins every time. Mgma.com.
https://mgma.com/data/data-stories/satisfaction-for-the-patient-wins-every-time
Murray, M., Davies, M., & Boushon, B. (2007). Panel Size: How Many Patients Can One Doctor Manage? Family Practice Management, 14(4), 44–51.
https://www.aafp.org/pubs/fpm/issues/2007/0400/p44.html
Nguyen, K. V. (2019, March 26). Hospital Call Center | Hospital Call Center Best Practices. 8x8.
https://www.8x8.com/blog/hospital-call-center-benchmarks?locale=us
Patient Gain. (n.d.). How Much Should A Medical Practice Spend on Marketing? PatientGain: Healthcare Marketing. Retrieved April 14, 2023, from
https://www.patientgain.com/much-medical-practice-spend-marketing
Salary.com. (2023, March 28). Medical Call Center Representative Salary. Salary.com.
https://www.salary.com/research/salary/posting/medical-call-center-representative-salary
Saleh, K. (2015, February 23). Customer Acquisition Vs.Retention Costs – Statistics And Trends. Invesp.
https://www.invespcro.com/blog/customer-acquisition-retention
Shryock, T. (2022, February 15). 69% of patients would switch providers for better services. MedicalEconomics.
https://www.medicaleconomics.com/view/69-of-patients-would-switch-providers-for-better-services
Shryock, T. (2023, February 28). Driving revenue growth in your medical practice. Physicians Practice.
https://www.physicianspractice.com/view/driving-revenue-growth-in-your-medical-practice
SQM Group. (2021, December 23). Call Transfer & Hold Performance Impact on Csat and FCR. SQM Group.
https://www.sqmgroup.com/resources/library/blog/call-transfer-hold-performance-impact-csat-and-fcr
SQM Group. (2022, May 11). Call Center Industry 2022 FCR Benchmark Results. SQM Group. https://www.sqmgroup.com/research
Sterling, G. (2015, November 12). Report: Bad Phone Experience Will Send 74 Percent Of Consumers To A Competitor. MarTech.
https://martech.org/report-bad-phone-experience-will-send-74-percent-of-consumers-to-a-competitor/
Suddreth, S. (2019, March 19). Providing an Exceptional Patient Experience Starts on the Phone. The Beryl Institute.
https://www.theberylinstitute.org/blogpost/947424/320212/Providing-an-Exceptional-Patient-Experience-Starts-on-the-Phone
TalkDesk. (2021). 2021 Talkdesk global contact center KPI benchmarking report - Reports. Talkdesk.
https://www.talkdesk.com/resources/reports/talkdesk-contact-center-kpi-benchmarking-report/
The Beryl Institute, & Ipsos PX Pulse. (2022). Consumer Perspectives on Patient Experience in the U.S. The Beryl Institute.
https://cdn.ymaws.com/www.theberylinstitute.org/resource/resmgr/pxpulse/TBI_PXPulse_Q3_Nov2022.pdf
West. (2017). Prioritizing the Patient Experience. West. https://www.jonespr.net/prioritizing-the-patient-experience
About Envera Health
Envera Health provides comprehensive engagement partnerships for healthcare organizations seeking to transform the patient experience and simplify the care deliver y process. Supported by a unique CRM-driven engagement center, we other a complete suite of patient engagement solutions custom-designed to improve operational efficiency and enable steady growth.